- Members Portal
- ABA Website

Deferrals Data, January 2021
15 March 2021
Only 9% of original deferrals remain deferred.
At January 31, total outstanding deferrals are just 9% of all loans that were deferred. Just 5% of small business loans remain deferred and 13% of housing loans. This means that there are about half the number of loans deferred in January that there were in December (as a reminder in December roughly 16% of loans remained deferred consisting of 10% of small business and 22% of housing).
On the books of the 4 majors, just 0.7 % of all small business loans, 1.4% of housing loans, and 0.5% of all loans are currently deferred.
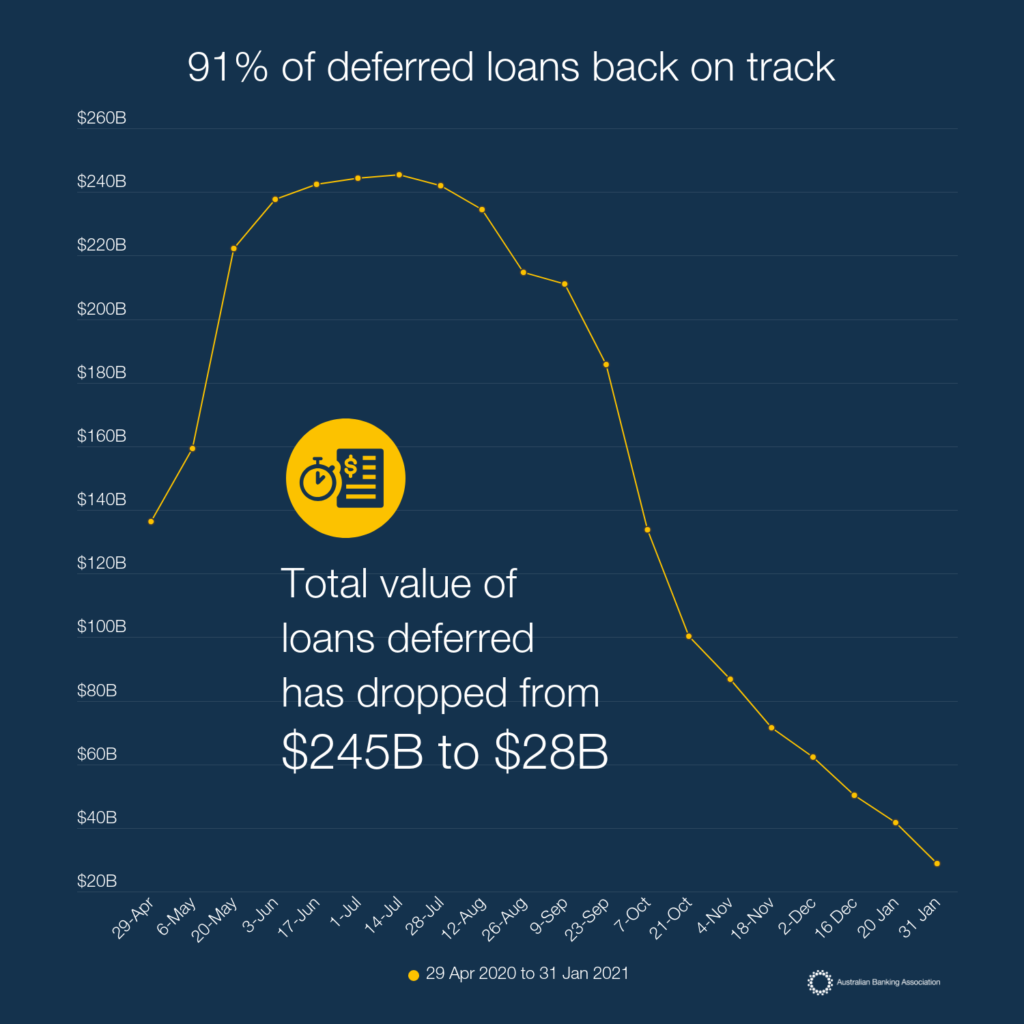
Table 1: Repayment deferrals requested & outstanding, $, N & %, January 31 2021
| Small business | Housing | Total | ||||
| VALUE | NUMBER | VALUE | NUMBER | VALUE | NUMBER | |
| $ | N | $ | N | $ | N | |
| Total requested to date | $55,934,733,245 | 239,976 | $182,395,960,288 | 449,621 | $259,049,579,798 | 839,537 |
| Exits to date | $58,025,299,575 | 217,171 | $180,594,989,904 | 451,112 | $259,090,624,929 | 794,399 |
| Credit outstanding | $2,509,114,218 | 11,263 | $25,453,687,848 | 60,562 | $28,776,726,069 | 78,556 |
| Relative to all deferred | 4% | 5% | 14% | 13% | 11% | 9% |
| Relative to all loans | 1.0% | 0.7% | 1.8% | 1.4% | 1.3% | 0.5% |
Note: Value and number of loan deferrals exited are larger than number and value of loan deferrals requested. This is due to loans being classified as exited where they had also been extended.
86% of all loan exited to performing status
Of all loans that have been exited, the majority (86%) exited to performing status (91% of small business loans and 85% of housing loans). These remain the same proportions as reported in December. Non-performing loans accounted for only 1.4% of exits to date, up from 1.2% in December. This consists of 0.8% of small business loans and 1.6% of housing loans. A further 3.3% of loans have been repaid in full, consisting of (4% of small business loans and 2.6% of housing loans).
Table 2a: Loan deferral applications & exits, Small business, Housing & Total, N & $, March – January 31, 2021
| Small Business | Housing | ||||||
| Value | Number | Value | Number | Value Number | |||
| Total exits to date | $58,025,299,575 | 217,171 | $180,594,989,904 | 451,112 | $259,090,624,929 | 794,399 | |
| O/w: performing | $51,916,392,161 | 198,391 | $152,971,814,592 | 384,203 | $220,806,504,302 | 686,420 | |
| O/w: restruct. & perf. | $914,500,279 | 1,702 | $3,187,307,656 | 7,031 | $4,239,581,114 | 9,033 | |
| O/w: non-commercial terms | No banks reported data. | ||||||
| O/w: non-performing | $643,098,856 | 1,792 | $3,005,719,587 | 7,668 | $4,072,193,096 | 10,856 | |
| O/w: outcome under neg. | Only one bank reported data. | ||||||
| O/w: def. extended | $2,240,036,903 | 6,276 | $20,468,514,961 | 48,527 | $23,780,730,595 | 67,503 | |
| O/w: repaid in full | $2,317,085,950 | 8,767 | $4,463,485,189 | 11,837 | $8,047,339,081 | 26,417 |
Note: Values have been removed where only one bank reported data. These values have not been used to calculate the overall percentages.
Note: Deferrals extended may include double counts, therefore the value and number of total deferral exits is less than the sum of the number and value of combined exit sub-categories. Percentages are calculated directly between sub-categories and the total exits as per the original reporting by banks.
Table 2b: Loan deferral applications & exits, Small business, Housing & Total, %, March – January 31, 2021
| Small business | Housing | |||||
| Value | Number | Value | Number | Value | ||
| Total exits to date | 100.0% | 100.0% | 100.0% | 100.0% | 100.0% | 100.0% |
| Of which: performing | 89.5% | 91.4% | 84.7% | 85.2% | 85.2% | 86.4% |
| O/w: restruct. & perf. | 1.6% | 0.8% | 1.8% | 1.6% | 1.6% | 1.1% |
| Of which: non-commercial terms | No banks reported data. | |||||
| Of which: non-performing | 1.1% | 0.8% | 1.7% | 1.7% | 1.6% | 1.4% |
| Of which: outcome under negotiation | Only one bank reported data. | |||||
| Of which: deferral extended | 3.9% | 2.9% | 11.3% | 10.8% | 9.2% | 8.5% |
| Of which: repaid in full | 4.0% | 4.0% | 2.5% | 2.6% | 3.1% | 3.3% |
Note: Values have been removed where only one bank reported data. These values have not been used to calculate the overall percentages.
Note: Deferrals extended may include double counts, therefore the value and number of total deferral exits is less than the sum of the number and value of combined exit sub-categories. Percentages are calculated directly between sub-categories and the total exits as per the original reporting by banks.
Latest news
Key News: “The Cash Distribution Framework is an important piece of regulatory reform to ensure the continued availability of cash given the decline in its usage and recent uncertainties across the sector.” ABA CEO Simon Birmingham. Media release, 3 September 2026. Media & Communications Update: Political Update: Economic Update: Regulatory Update Upcoming Submissions Selected Media… Read more »
Key News: “You might just think it’s harmless letting somebody access your bank account and getting a few hundred bucks in return, but these are crime syndicates, these are money launderers. You may well be helping to scam a vulnerable Australian out of their life savings.” ABA CEO Simon Birmingham. Interview with 2SM’s Tim Webster,… Read more »
Key News: “Every dollar of bank profits that gets reinvested into bank capital, generates on the analysis we showed this week, $4.70 of economic activity across the Australian economy.” ABA CEO Simon Birmingham. Interview with Ross Greenwood, 21 June. Media & Communications Update: Political Update: Economic Update: Regulatory Update Upcoming Submissions Selected Media Warm regards,The… Read more »